Studio Interface
R-studio’s graphical user interface provides a set of tools and information that make R software easy to use; for example, writing code, executing it, debugging it, or viewing results.
R-studio’s graphical interface is divided into 4 areas:
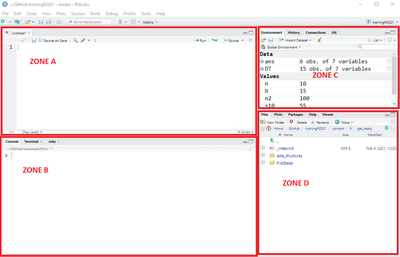
Zone A allows you to edit R code, i.e. to open, create or modify R command scripts.
Zone B is the console of the R software; it allows the execution of codes. Command lines can be entered directly into the console, or transferred from Zone A to Zone B by copy and paste, or by blocking the code you want to execute in Zone A and simultaneously pressing
Ctrl+Enterkeys.Zone C allows access to several items :
The “Environment” tab allows you to display the list of objects present in the memory of R, as well as the imported or created data sets. It is also possible to import data via the “Import Dataset” drop-down menu.
The “History” tab displays the history of the commands executed in the console.
Zone D also allows access to several elements :
- The tab “Files” allows to navigate in files
- The “Plots” tab gives access to the graph display and export window.
- The “Packages” tab gives access to a window for installing and updating packages.
- The “Help” tab gives access to the online help of all the functions of the packages loaded in R
- The “Viewer” tab is used to display certain files.
This is a very brief introduction to the features of the R-Studio.
For a more detailed introduction, you can watch the first 20 minutes of the video made by the creators of R-Studio Programming - Part 1 (Writing code in RStudio). (You can skip the installation part);